How MetaTrader 5 Helps Monitor Global Commodity Price Movements
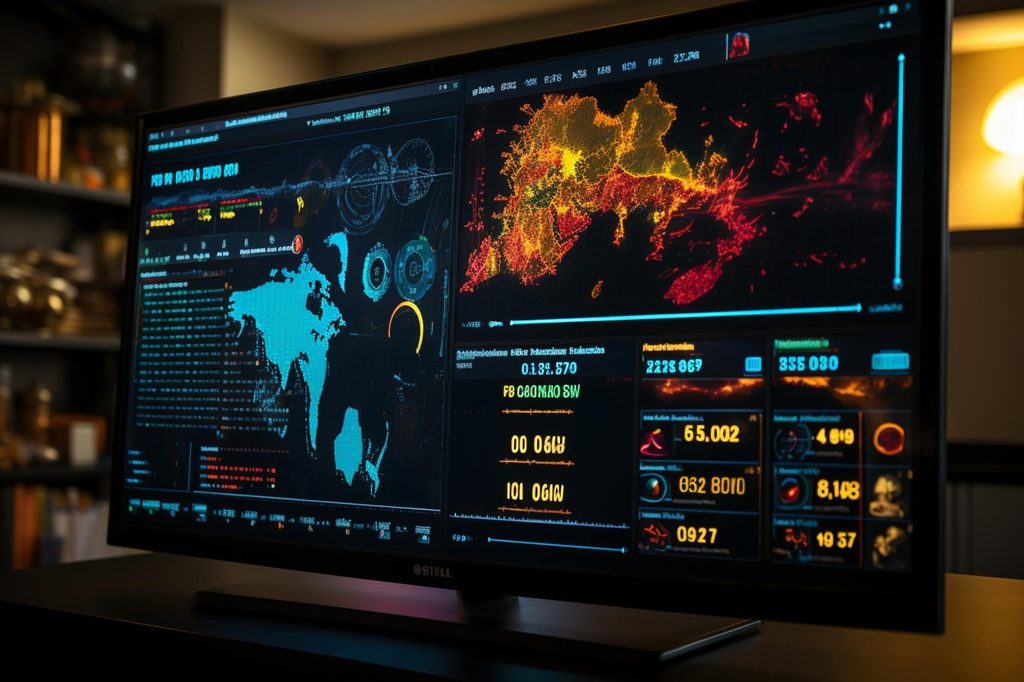
Global commodity prices can change rapidly as economic conditions, supply and demand, weather patterns, and geopolitical developments influence markets. Monitoring these movements requires access to useful charts, market information, and tools that help traders assess price behavior. MetaTrader 5 supports commodity market monitoring through advanced charting, price alerts, market analysis features, and trading tools.
Understanding how these capabilities work can help traders follow precious metals, energy products, and agricultural commodities more systematically while recognising that market movements remain uncertain and trading decisions involve financial risk.
Understanding Global Commodity Price Movements
Commodity markets include products used across industries and international trade. Precious metals such as gold, silver, platinum, and copper respond to changing economic expectations and industrial demand. Energy products, including oil and natural gas, can react to supply disruptions, consumption patterns, and geopolitical developments.
Agricultural commodities, such as cocoa, coffee, and sugar, may experience price changes linked to weather, harvest conditions, and availability. Since every commodity has distinct market influences, monitoring individual instruments helps traders understand price movements and assess changing market conditions more effectively.
Using Charts to Track Price Trends
Price charts help traders understand how commodity values change over time. MetaTrader 5 offers charting tools that allow users to examine price movements across different timeframes. Shorter timeframes can highlight immediate fluctuations, while longer periods provide context about broader market trends. Comparing these views helps traders distinguish temporary volatility from sustained price movements.
Charts can also reveal potential support and resistance levels where prices have previously struggled to move higher or lower. However, these levels do not guarantee future outcomes. Traders should combine chart observations with market information before making decisions.
Following Multiple Commodity Markets
Global commodity markets are interconnected, but each commodity responds to different economic and industry factors. Gold and silver prices may change with economic expectations, while oil and natural gas often respond to energy supply and demand. Agricultural commodities, including cocoa, coffee, and sugar, can experience fluctuations due to weather conditions, harvest outcomes, and availability.
Monitoring these markets individually helps traders understand their unique price movements and identify areas requiring further analysis. Using organized watchlists makes it easier to follow selected instruments, compare price trends, and maintain a consistent approach to observing global commodity market developments.
Using Technical Indicators for Market Analysis
Technical indicators help traders analyze commodity price movements by identifying trends, momentum, and potential changes in market behavior. Moving averages summarise prices over a selected period, helping traders understand the general direction of a market. Momentum indicators can show whether price movements are strengthening or weakening.
By combining these tools with chart patterns, traders can develop a broader understanding of market conditions. However, indicators rely on historical price data and cannot predict future movements with certainty. Traders should understand how each indicator works, consider current market conditions, and avoid depending on a single signal when analyzing commodity prices.
Monitoring Market News and Economic Events
Commodity prices often respond to economic announcements, production reports, weather conditions, and geopolitical developments. Monitoring these events helps traders understand factors that may influence market movements. An economic calendar highlights scheduled announcements, including inflation data and interest rate decisions, that can affect financial markets. Energy traders may follow information about oil and natural gas supply, while precious metals traders can assess changing economic expectations.
Reviewing relevant news alongside price charts provides additional context for interpreting fluctuations. However, market reactions are not always predictable. Combining event awareness with technical analysis supports informed decisions while recognizing the risks involved in commodity trading.
Setting Price Alerts and Tracking Key Levels
Price alerts help traders monitor selected commodity prices without watching charts continuously. When an instrument reaches a specified level, an alert can prompt further analysis. For example, traders following gold, oil, and coffee can set individual price levels based on their market observations. Tracking these levels helps identify movements that may require closer attention. However, reaching an alert level does not automatically indicate a suitable trading opportunity.
Prices can reverse direction or fluctuate sharply during volatile conditions. Traders should review current charts, relevant market information, and potential risks before making decisions, as alerts cannot guarantee outcomes.
Managing Positions During Changing Markets
Monitoring commodity prices is only one part of trading. Risk management helps traders prepare for unexpected market movements. Stop-loss and take-profit orders allow traders to set specific closing levels, subject to execution conditions and market availability. Pending orders can also specify the price at which a position should open, supporting a more structured trading approach.
Leverage requires careful consideration because it increases market exposure and can magnify losses. Traders should assess position sizes, market volatility, and potential downside before opening leveraged CFD positions. Regularly reviewing market conditions can support more informed decisions during changing commodity prices.
Building a Consistent Monitoring Routine
A consistent monitoring routine helps traders understand commodity price movements more effectively. Start by reviewing selected commodities, checking recent price changes, and identifying upcoming economic announcements. Compare charts across different timeframes and use indicators to assess market trends. Set price alerts for important levels to avoid constant screen monitoring.
When using MT5 trading tools, understand how alerts, indicators, and order controls work before making decisions. Record observations and review previous decisions to identify areas for improvement. Most importantly, avoid reacting impulsively to sudden price changes and consider potential losses before taking any trading position.
Conclusion
Monitoring commodity markets requires a combination of price observation, technical analysis, economic awareness, and disciplined risk management. Charts, indicators, watchlists, alerts, and economic calendars can help traders organize information and assess changing conditions across metals, energy products, and agricultural markets. MetaTrader 5 brings analytical and trading capabilities together, supporting a more structured approach to market monitoring. Nevertheless, no platform or indicator can eliminate uncertainty, predict every price movement, or guarantee trading profits.
Discover how technology and market insights can support more informed commodity trading decisions across global financial markets. Baazex offers access to global commodity CFD markets, including gold, silver, platinum, copper, oil, natural gas, cocoa, coffee, and sugar. Traders can use MetaTrader 5 alongside charting tools, price alerts, an economic calendar, and risk-management features. With demo accounts, multiple device options, and transparent pricing features, Baazex supports informed market monitoring. Explore its trading services and understand the risks before trading.